Struggling to buy in today’s market, buyers, new and experienced alike are beginning to ask really big questions about jumping into such a competitive market knowing that they will most likely be “house rich but cash poor”, that they may not be able to afford the taxes the first few years and eat ramen to make ends meet. One client, in particular, asked:
- What is this crazy market going to do?! Is there any data we can look at to give us a sense of what the market has done and what it may do in the future?
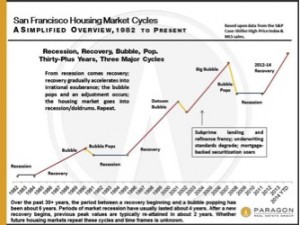
Looking at long-term trends is the best way to get a sense of where the market has been and where it might be going. The Paragon Real Estate Group has pulled together some great data that show 30-year trends. (to see more data from Paragon, click here)
In looking at the graph, you can clearly see recession, recovery and plateau cycles – three of them in the last thirty years. Seems to stand to logic that some areas in the Bay Area were harder hit during the recessions and maybe didn’t recover quite as quickly as San Francisco but as we are seeing now they do recover eventually (see recent report that Oakland prices are up 50% in the last year).
Looking at this graph, how do you feel about buying a house in the Bay Area?
