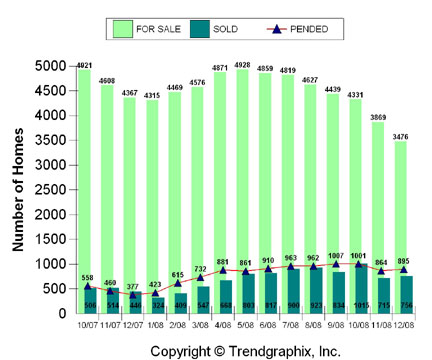
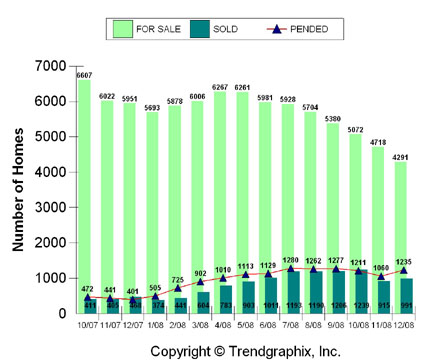
The first graph is for single family homes in Alameda County, the second graph is Contra Costa County. The blue bar shows “sold,” the green bar shows “for sale,” and the triangles show “pending.”
First of all, let’s look at the obvious. Both graphs show a similar pattern with January being the lowest in inventory. In February inventory goes up, peaks in April/May, and then starts to go back down. In Oct. 2007 the market and economy were completely different yet the pattern is still the same.
Look how low inventory got late 2008, yet sales were up from the same time the year before. Why is this? Money is a lot cheaper right now, and with home prices falling across both counties, more people are able to enter the market, including first time homebuyers and investors. Both counties are experiencing opposing economic microclimates: certain areas within each county are experiencing record numbers of foreclosures while others are holding strong, and even experiencing multiple offers.
As the next wave of loans are about to reset inventory will continue to climb, as will the number of foreclosures. I expect this wave to be consistent throughout the rest of the year.

